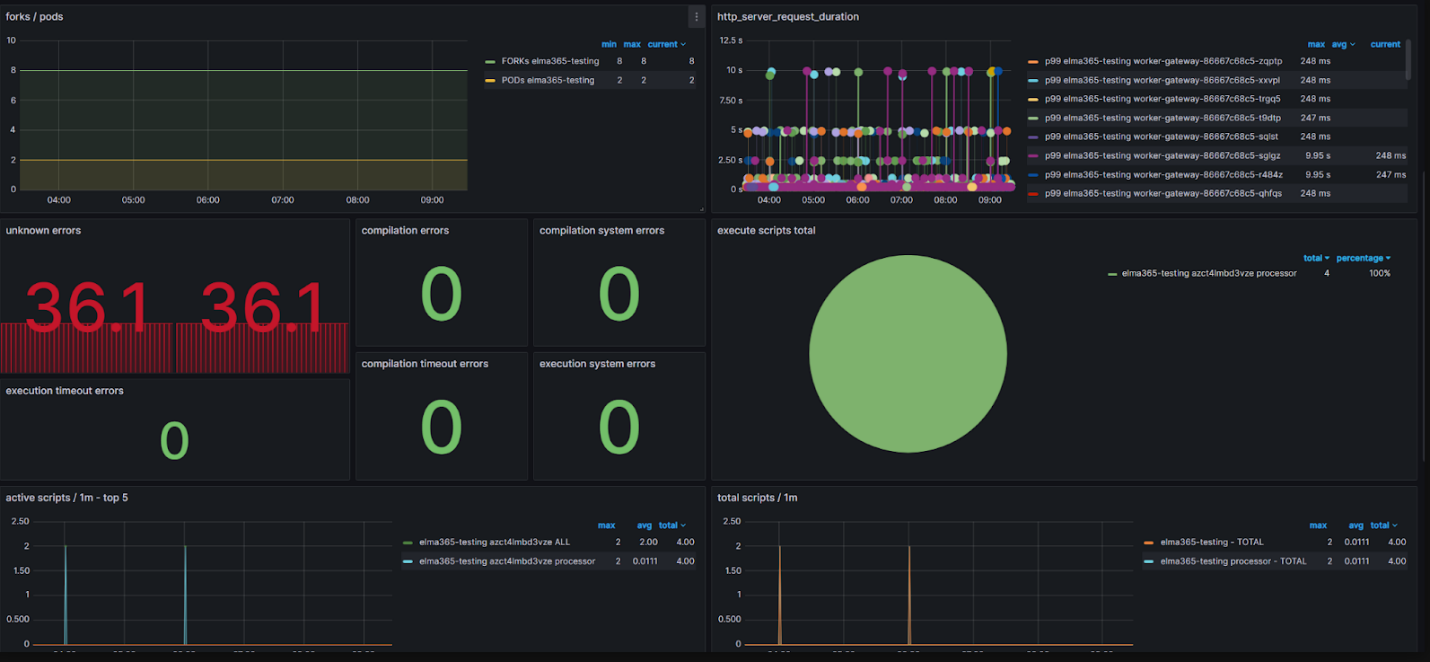
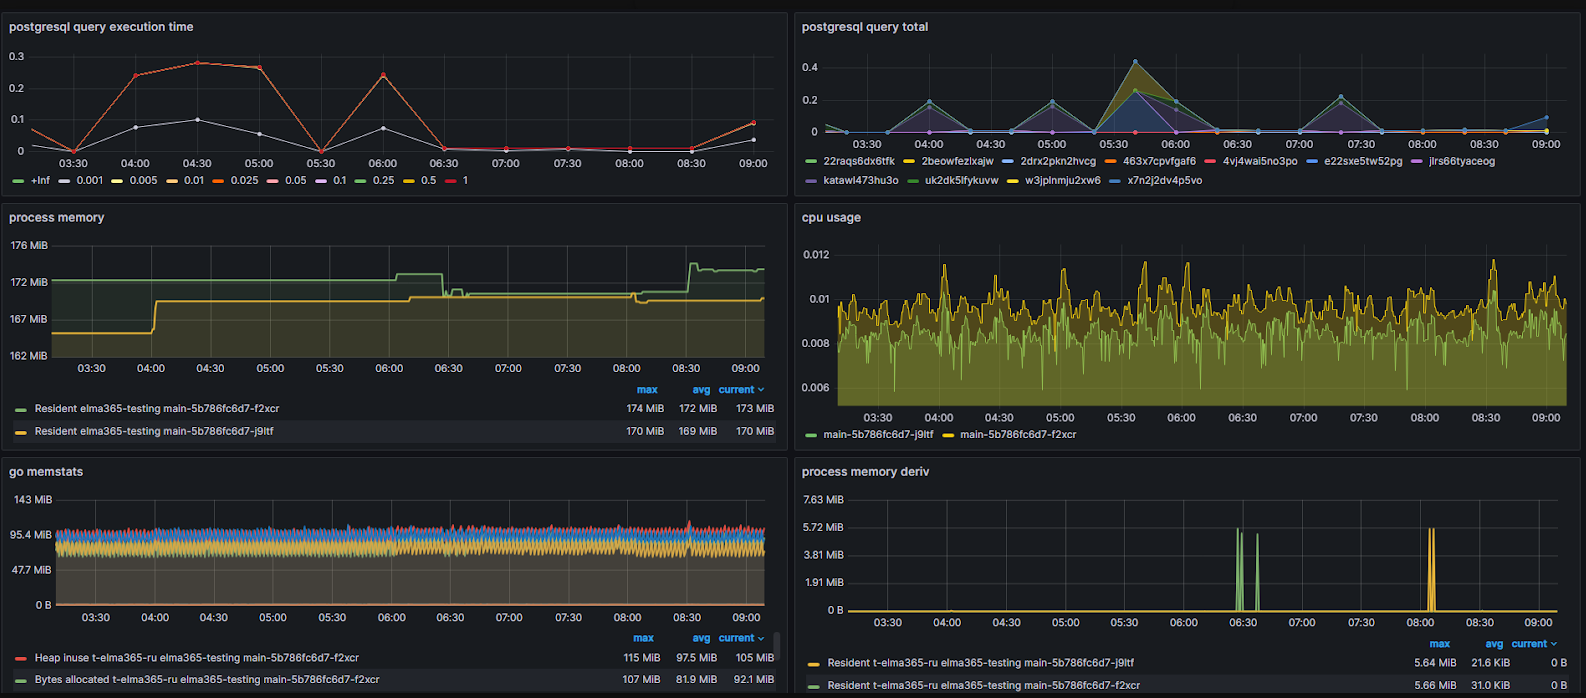
You can track the status and key metrics of microservices responsible for executing business processes in HUMMIX using dashboards.
Attention
When installing an additional instance of HUMMIX On-Premises, dashboards are loaded into a folder with the name of the new namespace. The installation of Prometheus is not required.
To activate dashboards and metrics, enable the dashboards.enabled parameter in the values file for monitoring tool installation.
# enable dashboards for grafana
monitoring:
enabled: true
metrics:
enabled: true
all: true
provisioner: "k8s"
dashboard:
enabled: true
alerts:
enabled: true
Examples of charts in the data visualization software Grafana:
- chart of the main microservice;
- chart of the worker microservice.